Weird issue with WAN latency graph on dashboard widget, ER7206 v2 2.2.0
 This thread has been locked for further replies. You can start a new thread to share your ideas or ask questions.
Weird issue with WAN latency graph on dashboard widget, ER7206 v2 2.2.0
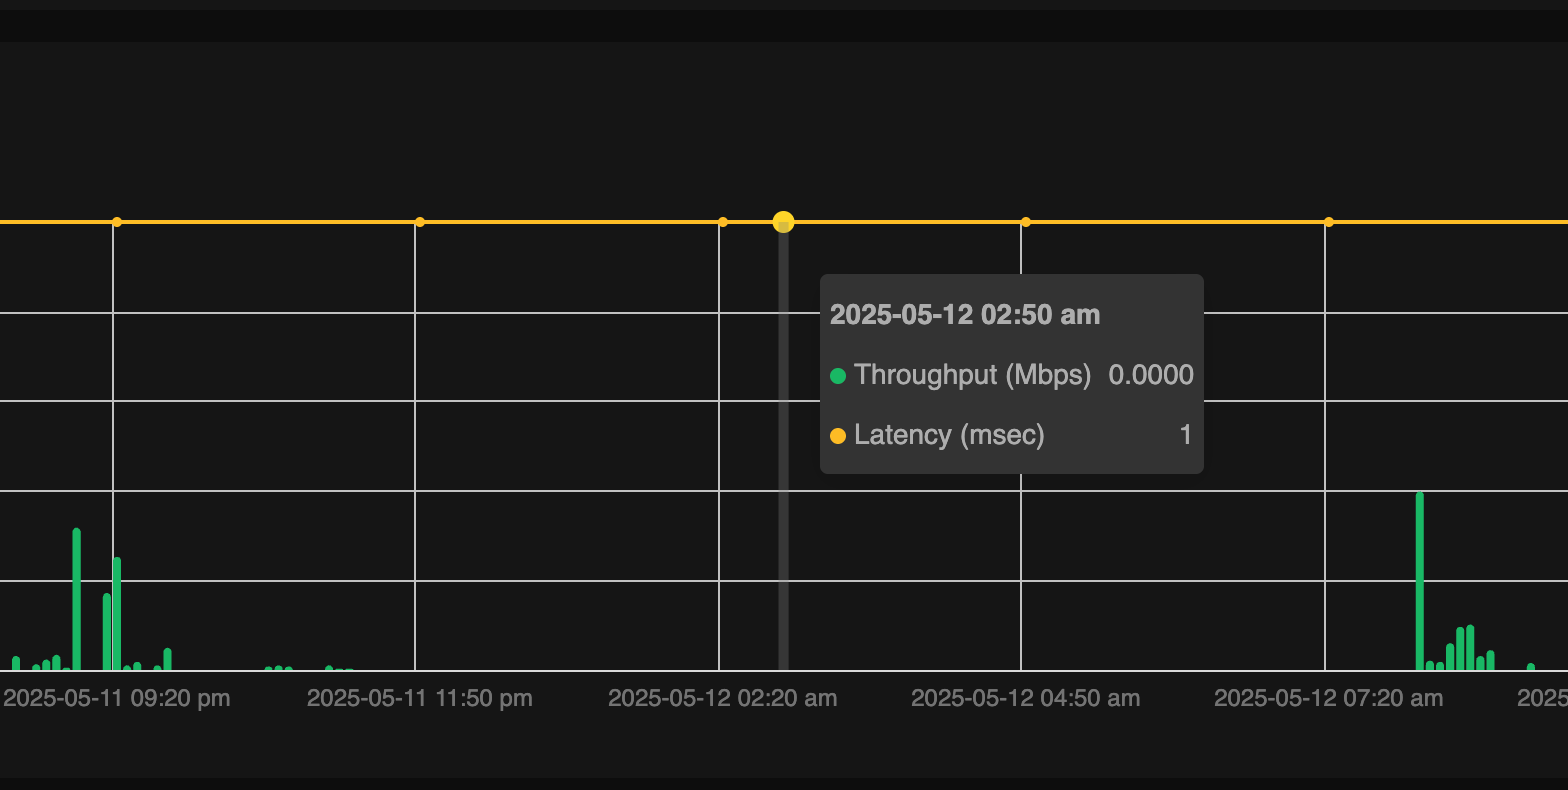
This thread has been locked for further replies. You can start a new thread to share your ideas or ask questions.Got a strange one with my WAN traffic graph, dashboard widget ("ISP Load") on my ER7206 v2 running 2.2.0 latest
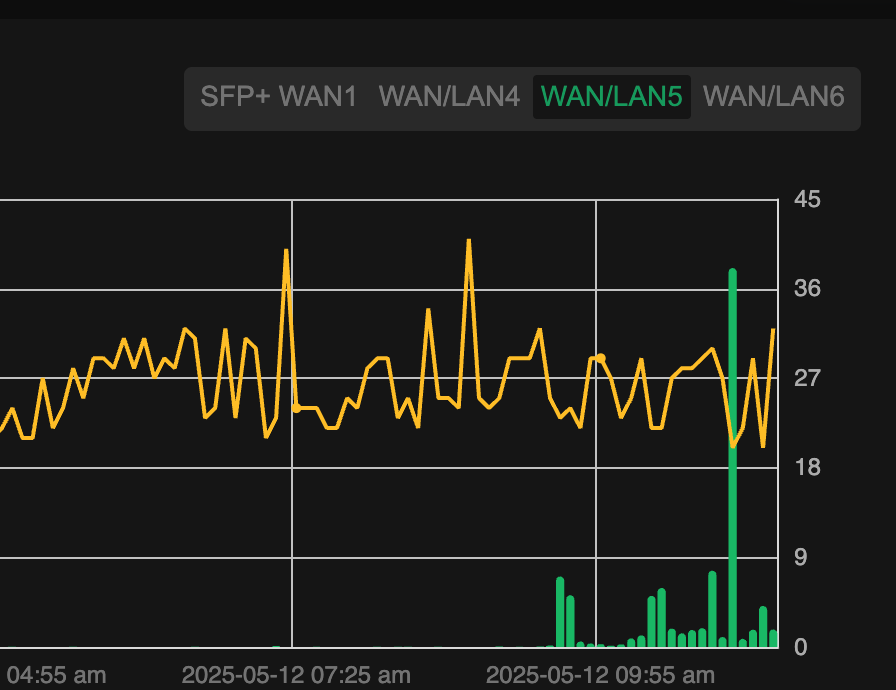
The graph constantly reports a WAN latency of 1ms, completely flat
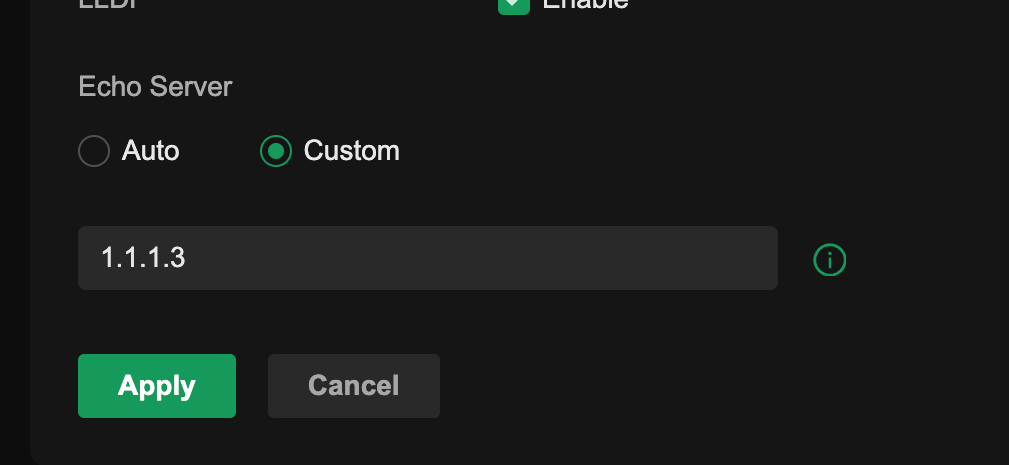
Echo server is ON, and tried both Auto and an external IP
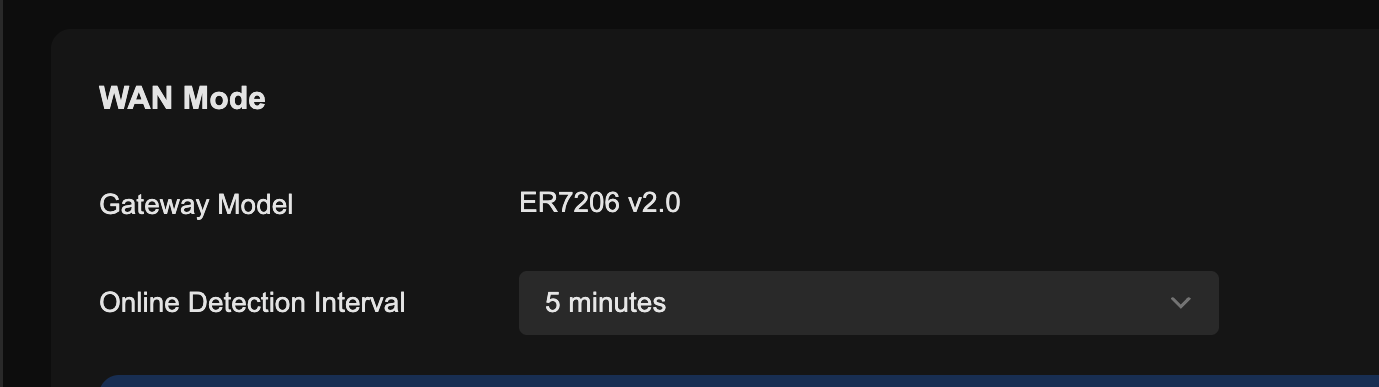
Online detection is active, set to 5 minutes
I do not see this problem with ER8411 (on the now revoked 1.3.0) or ER605v2 on 2.3.0 and the same setting on those sites.
OC300 5.15.20.38
I factory reset and re-adopted the router a couple days ago to see if that cleared it and it did not, also factory reset the controller and restored backup, no change
I dont have any issue with WAN connectivity on the router, its jsut this graph that is acting up
- Copy Link
- Subscribe
- Bookmark
- Report Inappropriate Content
I also tried something else today
Im in the UK, and i found some small hosting company in brazil, found their public IP, and set that as my echo server. Same 1ms for the whole time i had that set which is definitely wrong! Real ping times to them were in the hundreds of miliseconds
- Copy Link
- Report Inappropriate Content
FYI, I reposted the bug here : https://community.tp-link.com/en/business/forum/topic/818848
Seems this bug will have a fix in next firmware.
- Copy Link
- Report Inappropriate Content
- Copy Link
- Report Inappropriate Content
Information
Helpful: 0
Views: 2009
Replies: 13
Voters 0
No one has voted for it yet.