Different traffic data for the same time.
 This thread has been locked for further replies. You can start a new thread to share your ideas or ask questions.
By default, the Omada controller (v5.15.20.21/Windows) shows the Traffic Activities graph in the "Last 24 hours" mode. In this mode, on 05/16/2025 at 18:00 it shows that 189.01 MB were transferred:
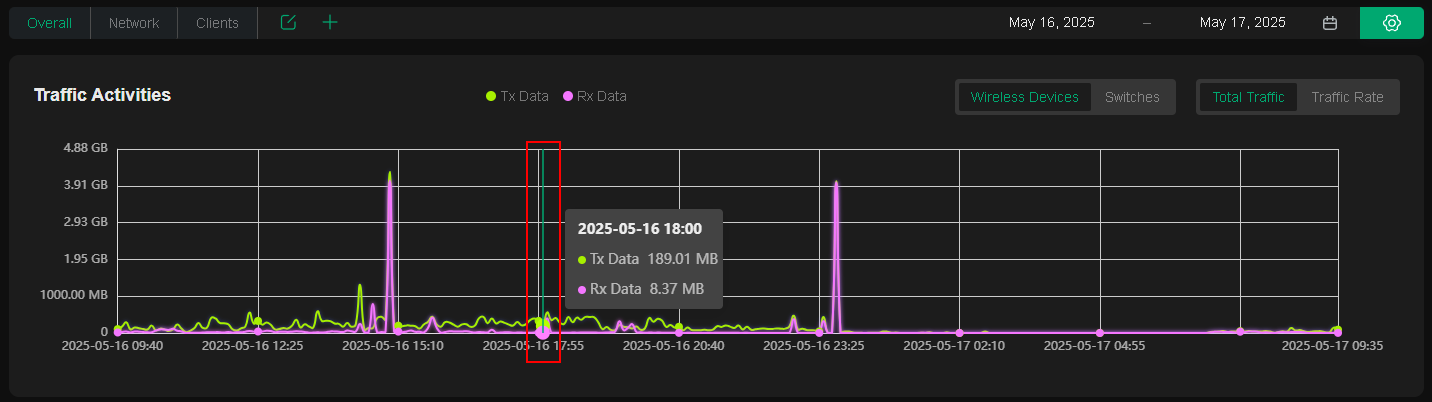
If I select the "Yesterday" graph display mode, then on this graph it already shows 3.41 GB on 05/16/2025 at 18:00:
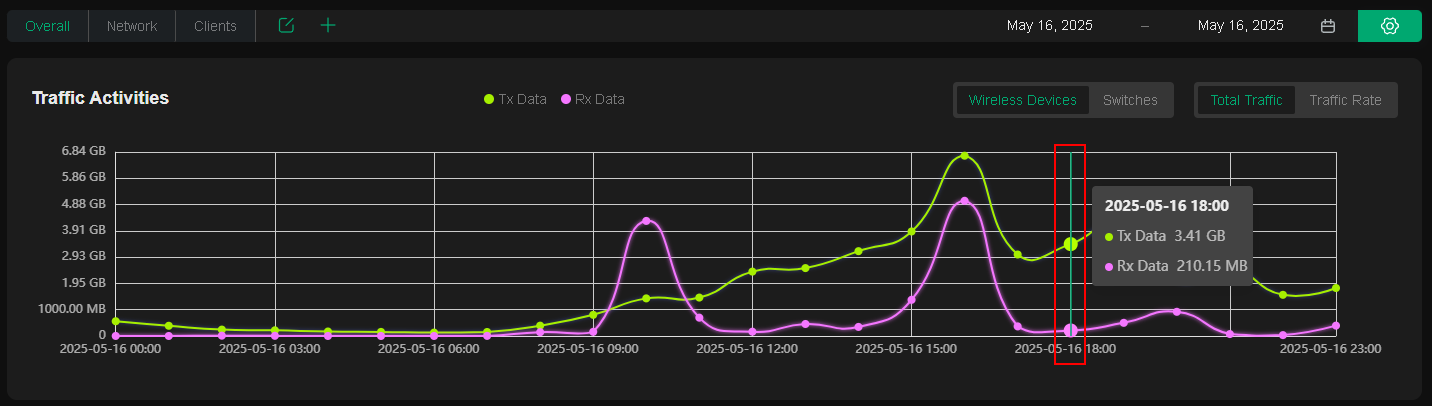
How can this be? How much was actually received? 189.01 MB or 3.41 GB??
- Copy Link
- Subscribe
- Bookmark
- Report Inappropriate Content
Hi @Vincent-TP
The situation is clearer.
The problem was that with the default settings (Last 24 hours), this table calculates traffic statistics at 5-minute intervals. This means each data point represents the total traffic volume during the preceding 5-minute period. For example, when you view data for 18:00, it actually shows the aggregated traffic from 17:55 to 18:00.
However, when you select "Yesterday" view, the statistics interval changes to 1-hour. Then each data point represents the total traffic during the preceding hour. For instance, the 18:00 data point would show traffic aggregated from 17:00 to 18:00.
Technical support promises to optimize this function.
- Copy Link
- Report Inappropriate Content

Hi @KSab
I just tested it on my local controller, and everything appears to be working fine.
Have you checked the data from other time points? Will the same thing happen?
Please also try restarting the controller and check again.
- Copy Link
- Report Inappropriate Content
Hi @Vincent-TP
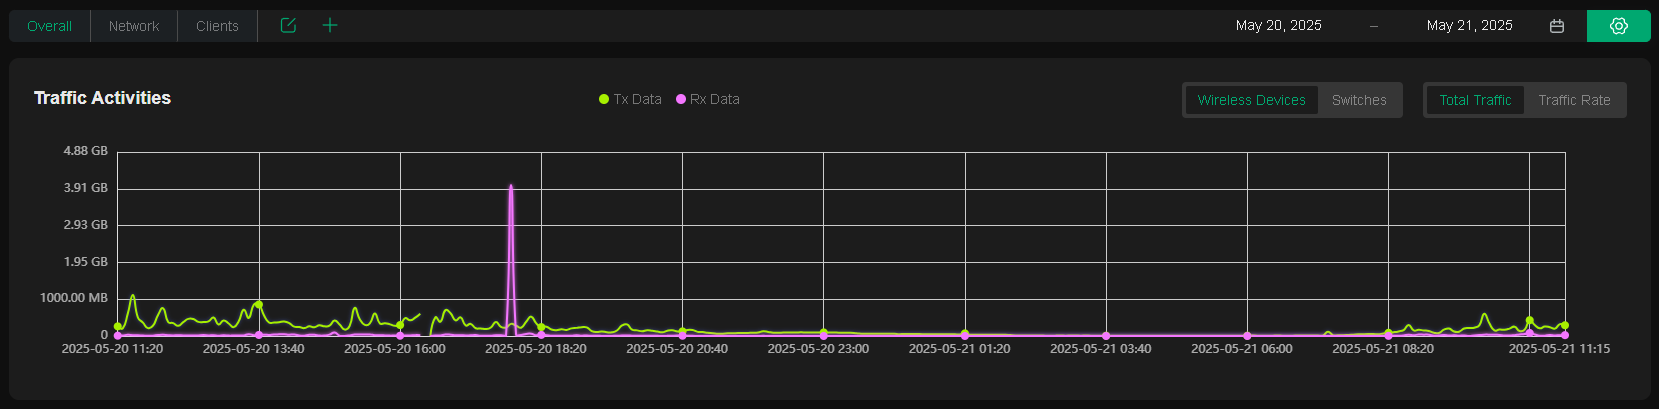
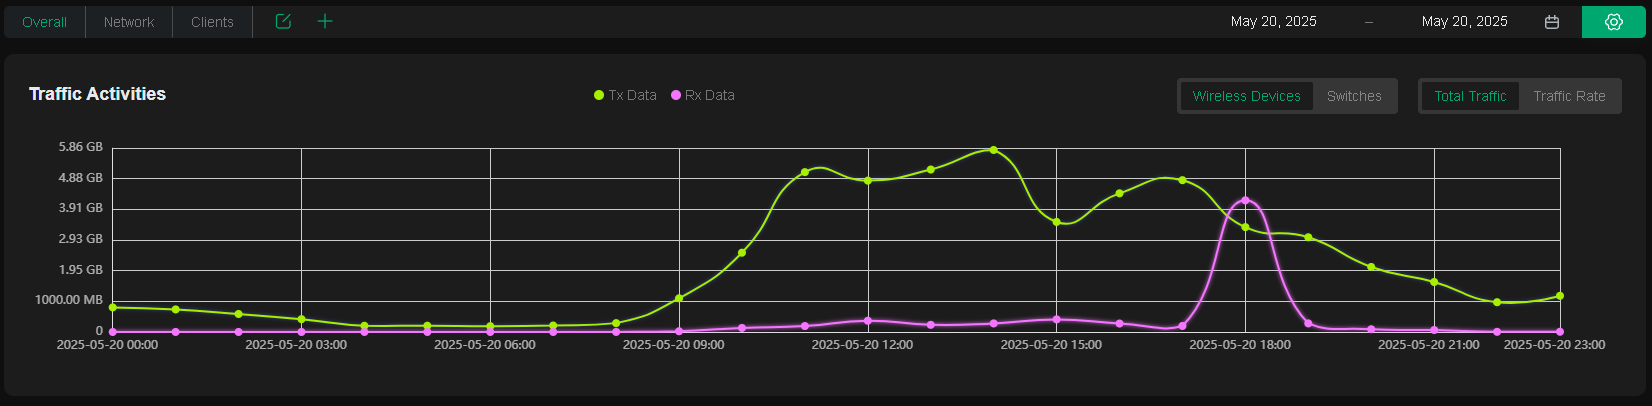
Below are 3 charts for comparison: Last 24 hours, Today, Yesterday.
If the number of megabytes in the Last 24 hours and Today charts coincide on the time scale, then the data on the Yesterday chart is significantly higher! What's wrong?
And only the TX data is different! The RX data - they match correctly on the charts.
Last 24 hours (default):
Today:
Yesterday:
- Copy Link
- Report Inappropriate Content
Hi @KSab
We have a new pre-release version, would you like to update it and see if the issue persist?
Omada SDN Controller_V5.15.24 Pre-Release Firmware (Update on 14th May, 2025)
- Copy Link
- Report Inappropriate Content
Hi @Vincent-TP
Updated the controller to version v5.15.24 Pre-Release.
The situation has not changed.
Last 24 hours:
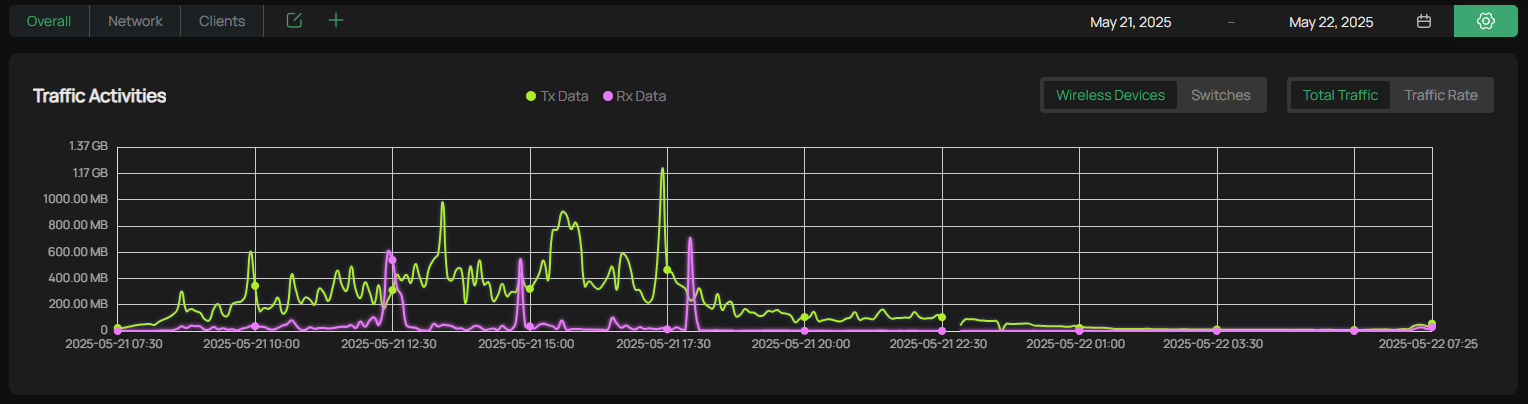
Yesterday:
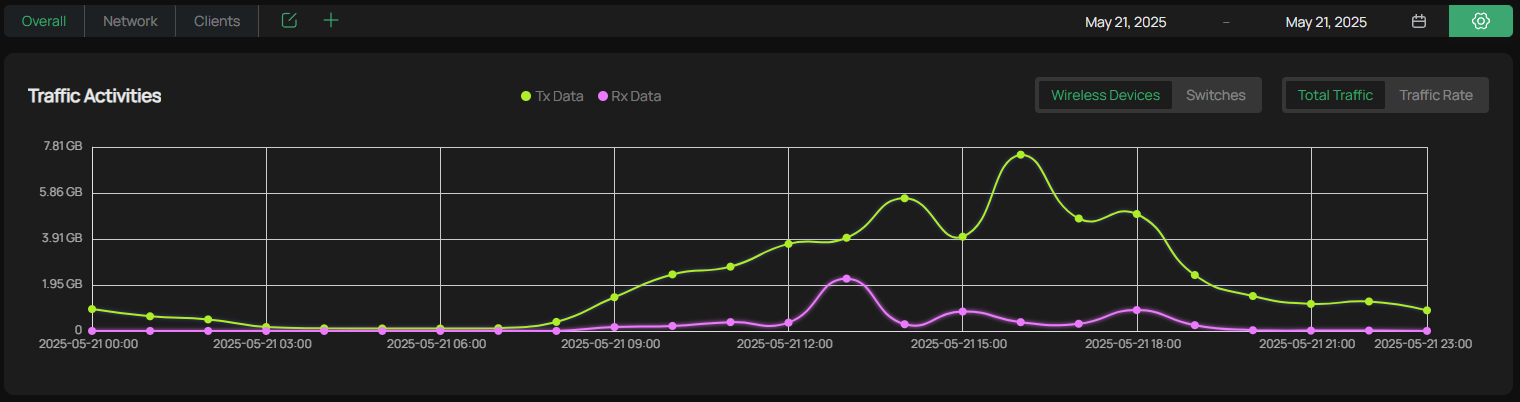
After the update, now the RX data is also displayed incorrectly.
- Copy Link
- Report Inappropriate Content
Hi @KSab
Thank you so much for taking the time to post the issue on TP-Link community!
To better assist you, I've created a support ticket via your registered email address, and escalated it to our support engineer to look into the issue. The ticket ID is TKID250541912, please check your email box and ensure the support email is well received. Thanks!
Once the issue is addressed or resolved, welcome to update this topic thread with your solution to help others who may encounter the same issue as you did.
Many thanks for your great cooperation and patience!
- Copy Link
- Report Inappropriate Content
Hi @Vincent-TP
The situation is clearer.
The problem was that with the default settings (Last 24 hours), this table calculates traffic statistics at 5-minute intervals. This means each data point represents the total traffic volume during the preceding 5-minute period. For example, when you view data for 18:00, it actually shows the aggregated traffic from 17:55 to 18:00.
However, when you select "Yesterday" view, the statistics interval changes to 1-hour. Then each data point represents the total traffic during the preceding hour. For instance, the 18:00 data point would show traffic aggregated from 17:00 to 18:00.
Technical support promises to optimize this function.
- Copy Link
- Report Inappropriate Content
Hi @KSab
Thanks for the update.
If you encounter any further problems or have additional questions, feel free to reach out. We're here to help! 😊
- Copy Link
- Report Inappropriate Content
Information
Helpful: 0
Views: 780
Replies: 7
Voters 0
No one has voted for it yet.