ES208G Switch count traffic on wrong mac address.
 This thread has been locked for further replies. You can start a new thread to share your ideas or ask questions.
the product is great. however the traffic counter count against incorrect device.
i use the cloud version of controller
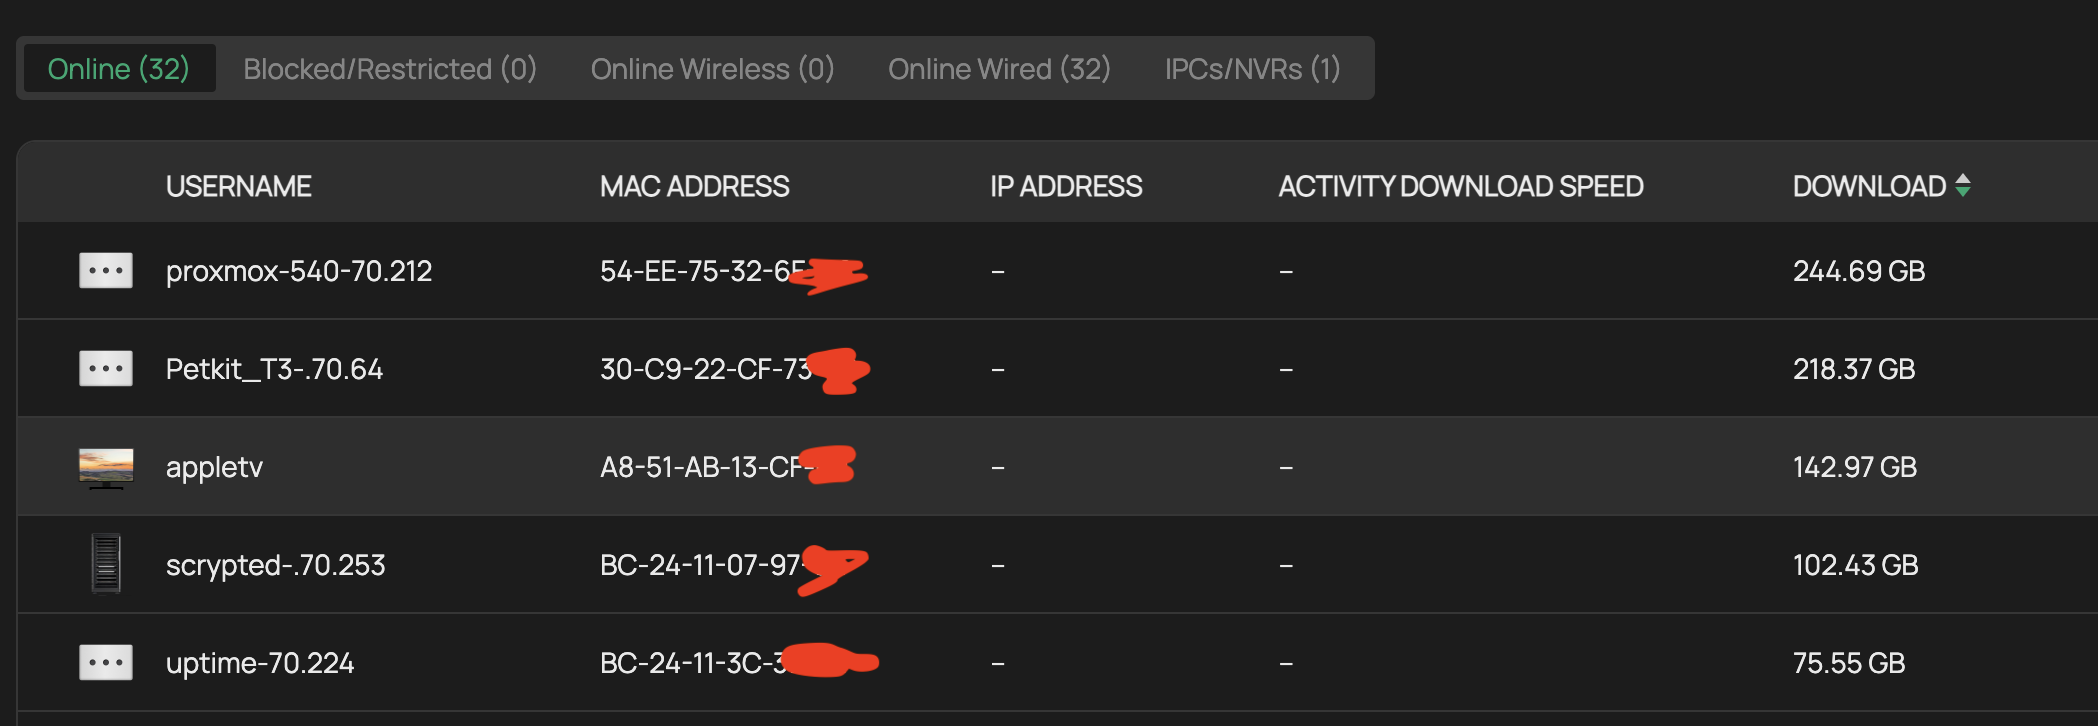
here is the traffic counter dashboard that i see, I think the number of traffic is fairly accurate. but I think the mac address of traffic assignment is just wrong.
the traffic level of device (petkit) should be like 2 mb,
but other device that should use 200 GB wasn't show up as used. it's show 0 mb.
attach information

- Copy Link
- Subscribe
- Bookmark
- Report Inappropriate Content

Hi @Suvi
Thanks for the feedback---We can't easily call it a bug.
It appears that all traffic from the devices connected to the Xiaomi router is being reported by the router itself.
The Xiaomi router has NAT (Network Address Translation), which prevents our device from directly accessing information within the Xiaomi router's LAN (as it gets blocked by NAT). The only way we can obtain this data is if the Xiaomi router reports it.
Currently, the Xiaomi router aggregates all client traffic and reports it as a single client's data, without distinguishing between individual devices. As a result, the traffic statistics we receive appear as if they're coming from just one client.
This behavior is actually expected under these network conditions.
To avoid this, you may plug the switch ES208G into the LAN port of the Xiaomi router.
- Copy Link
- Report Inappropriate Content
Hi @Suvi
Thanks for posting here.
To understand the situation better, please let us know the following info:
1. What kind of client is the petkit? Is it an IoT device? Please also let us know the brand.
2. but other device that should use 200 GB wasn't show up as used. it's show 0 mb.
>>>What kind of this device is?
3. Is this only happening with the mentioned two clients?
4. Are they both plugged into the switch ES208G?
5. What's the firmware version of the switch is?
In the meantime, please refresh the controller page, the web browser page. And log in the controller with a different wbe browser.
- Copy Link
- Report Inappropriate Content
petkit is iot device. The petkit traffic should not travel to this switch at all.
200gb is mac book
FW 1.0.2 Build 20250609 Rel.74647
The problem seems to be a few swap combination.
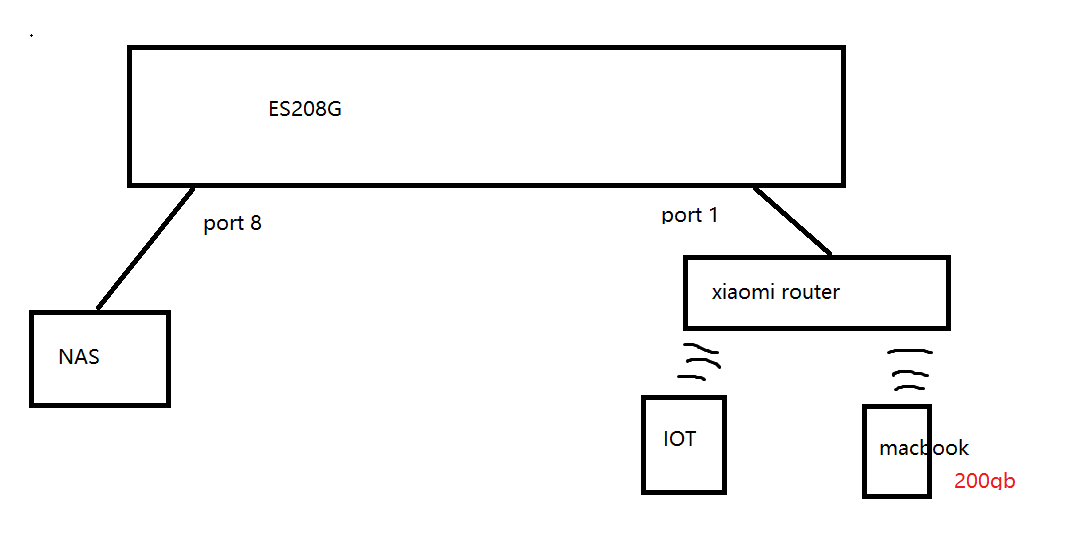
They both plug to port 01 via xiaomi ax9000 router.
the mac book need to reach nas on port 08 which when the traffic travels through this switch.
- Copy Link
- Report Inappropriate Content
Hi @Suvi
Thanks for the reply.
To verify, the connection is as below:
Apart from the mentioned IoT client and the MacBook, is there any other clients in the network displaying inaccurate traffic?
- Copy Link
- Report Inappropriate Content
@Vincent-TP
only 7 device is getting count number. and it's seem to be a random summary of something.
- Copy Link
- Report Inappropriate Content
@Vincent-TP it's like all of the network (31-32 object) traffic is summary to just 7 device.
- Copy Link
- Report Inappropriate Content
Hi @Suvi
Thanks for the info.
What do these 7 devices have in common? For example, are they all connected to an ES208G?
Suvi wrote
@Vincent-TP it's like all of the network (31-32 object) traffic is summary to just 7 device.
- Copy Link
- Report Inappropriate Content
Executive Summary
Critical Bug: TP-Link Omada Cloud infrastructure contains a hash collision bug in client traffic accounting that causes incorrect traffic attribution. Multiple MAC addresses hash to the same bucket, resulting in traffic from multiple devices being incorrectly credited to a single device while other devices show zero traffic despite being active.
Impact: Inaccurate network monitoring, impossible bandwidth planning, and inability to identify actual high-traffic devices.
Affected Systems: TP-Link Omada Cloud-managed networks with switch-only deployments
Bug Description
Primary Issue
The Omada Cloud backend uses a flawed MAC address hashing algorithm for client traffic tracking that causes hash collisions. When multiple devices hash to the same bucket, all traffic from those devices gets attributed to one "dominant" device in the bucket while other devices show exactly 0 bytes for both upload and download.
Key Evidence
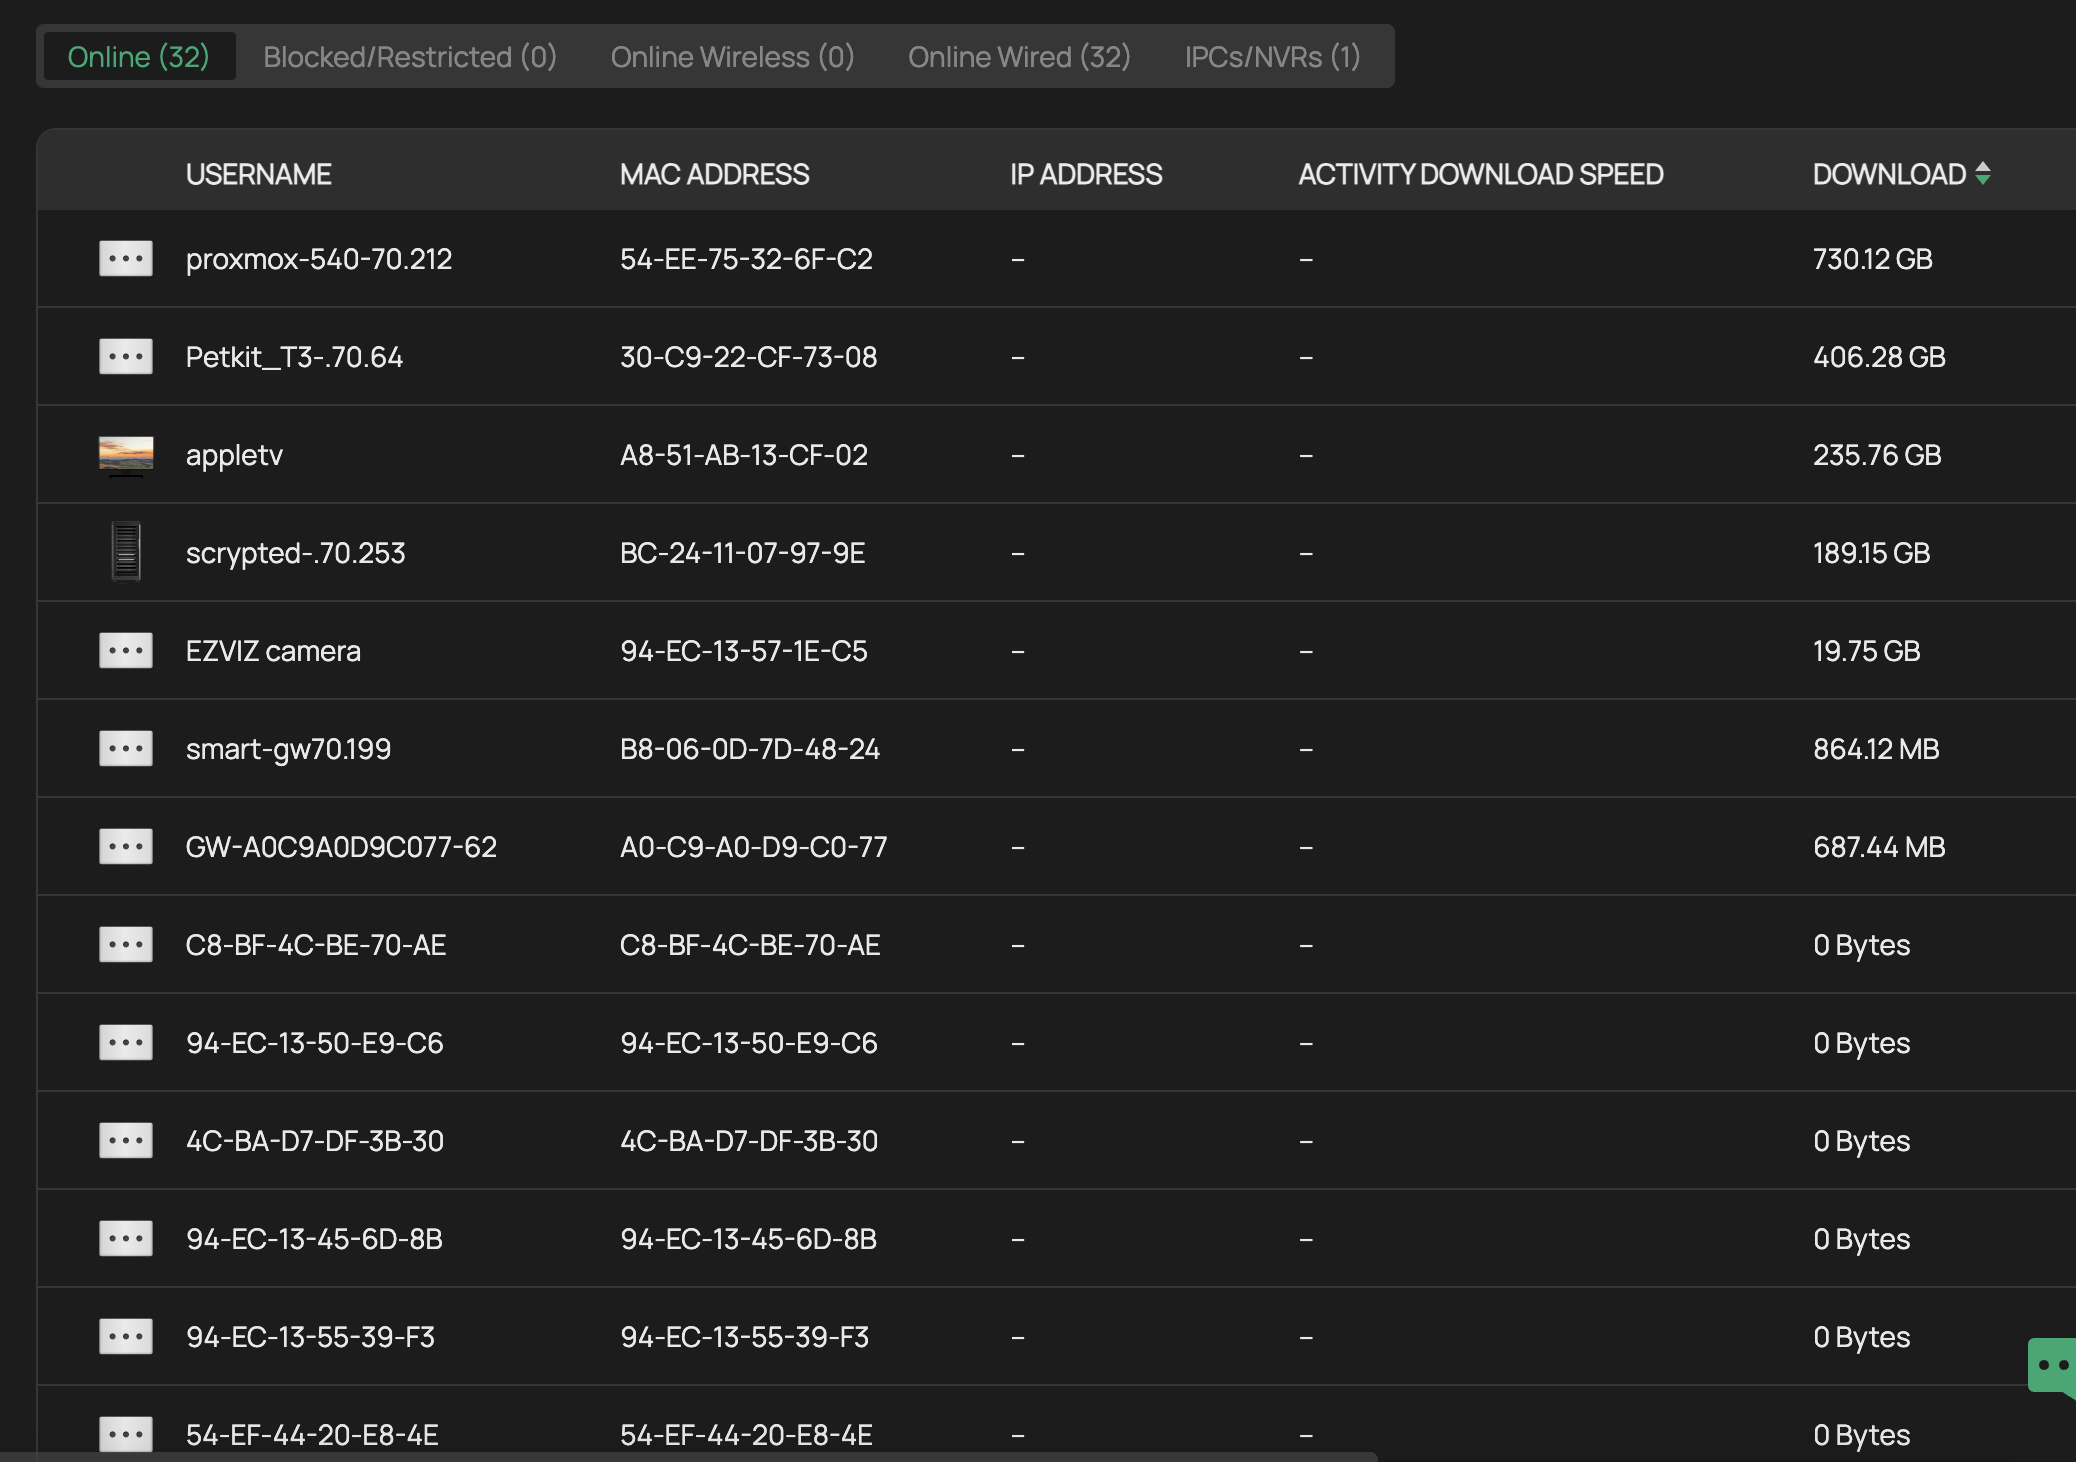
- Exactly 32 devices detected (2^5) - indicates 5-bit hash table
- Multiple devices with 4+ days uptime showing 0 bytes traffic
- Few devices showing extremely high traffic volumes (likely absorbing traffic from collision partners)
- Pattern persists across different switch ports (rules out local switch issues)
Environment Details
Network Setup
- Controller Type: TP-Link Omada Cloud
- Hardware: Switch-only deployment (no wireless APs or gateways)
- Device Count: 32 devices (critical mass for hash collisions)
- Management: Cloud-based via Omada Cloud service
Affected Device Examples
High-Traffic Devices (Traffic Absorbers)
| Device Name | MAC Address | Traffic | Suspected Issue |
|---|---|---|---|
| proxmox-540-70.212 | 54-EE-75-32-6F-C2 | 934.67 GB down / 273.02 GB up | Absorbing traffic from collision partners |
| appletv | A8-51-AB-13-CF-02 | 411.78 GB down / 358.58 GB up | Absorbing traffic from collision partners |
| 54-EF-44-20-E8-4E | 54-EF-44-20-E8-4E | 232.55 GB down / 349.64 GB up | Absorbing traffic from collision partners |
| scrypted-70.253 | BC-24-11-07-97-9E | 343.25 GB down / 84.98 GB up | Absorbing traffic from collision partners |
Zero-Traffic Devices (Collision Victims)
| Device Name | MAC Address | Uptime | Expected Traffic |
|---|---|---|---|
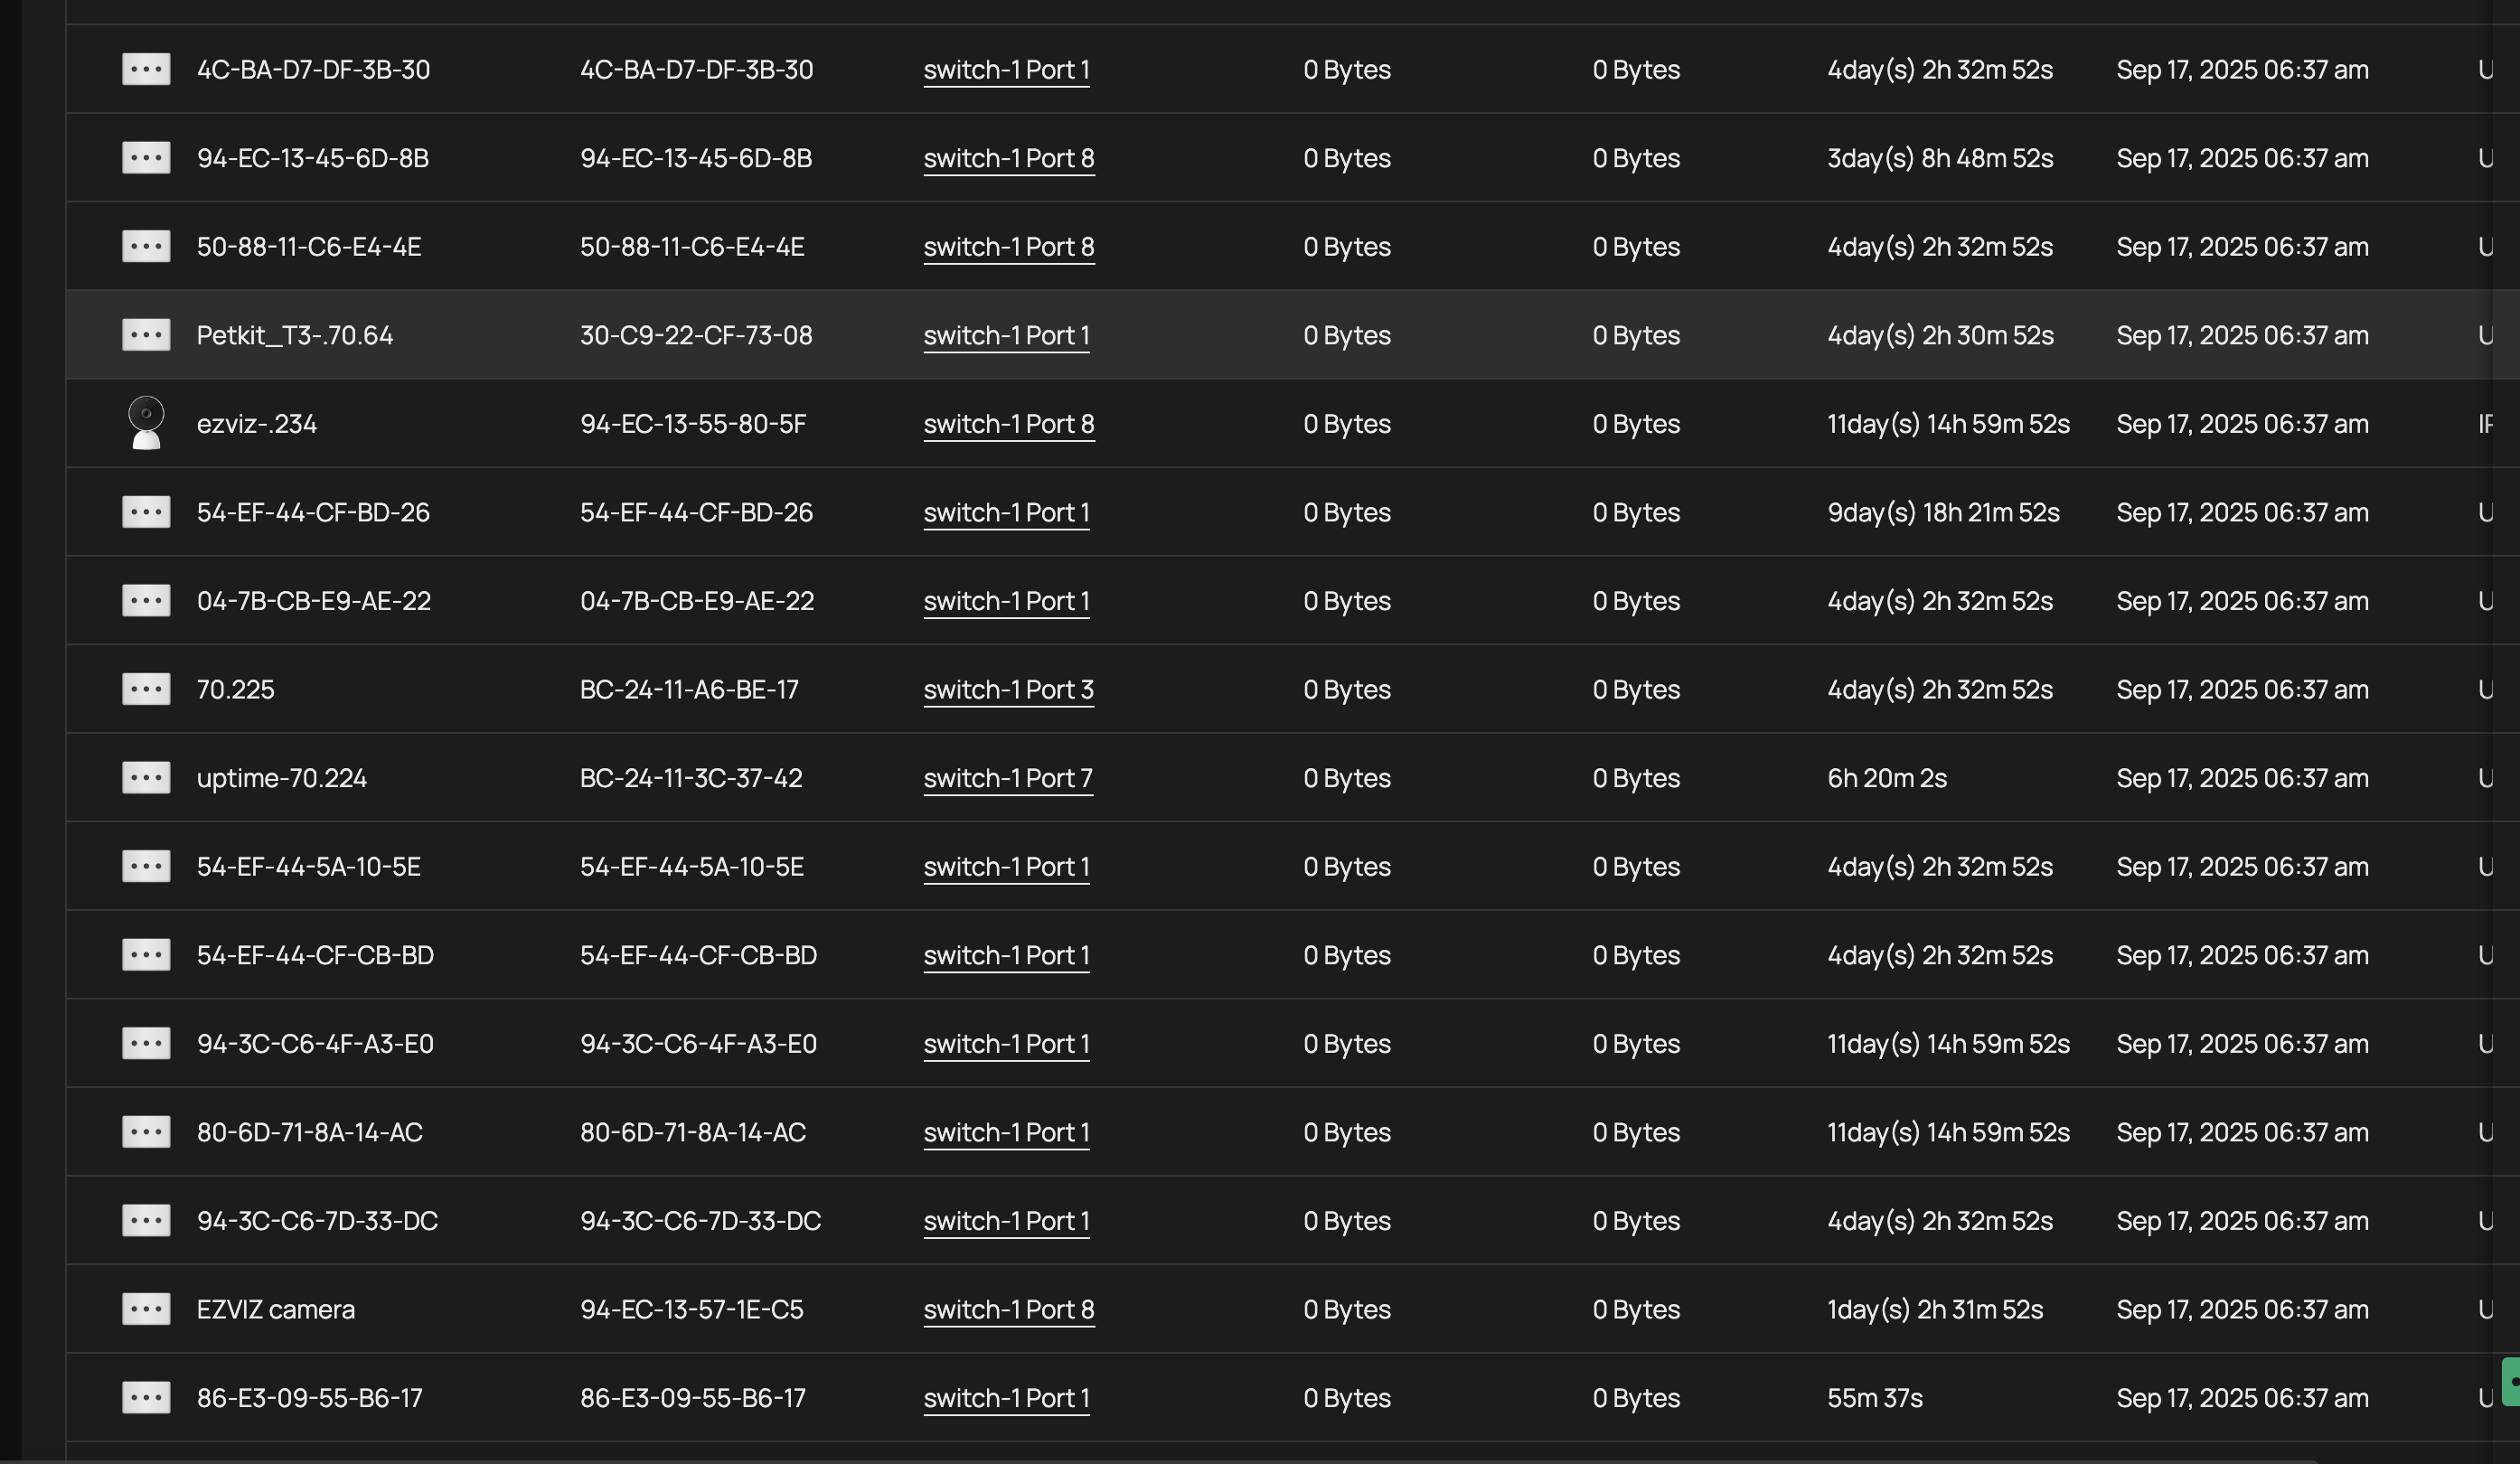
| 4C-BA-D7-DF-3B-30 | 4C-BA-D7-DF-3B-30 | 4 days, 2h 32m | Should show some traffic |
| 94-EC-13-45-6D-8B | 94-EC-13-45-6D-8B | 3 days, 8h 48m | Should show some traffic |
| 50-88-11-C6-E4-4E | 50-88-11-C6-E4-4E | 4 days, 2h 32m | Should show some traffic |
| Petkit_T3-70.64 | 30-C9-22-CF-73-08 | 4 days, 2h 30m | Should show some traffic |
| ezviz-234 | 94-EC-13-55-80-5F | 11 days, 14h 59m | Should show some traffic |
| EZVIZ camera | 94-EC-13-57-1E-C5 | 1 day, 31m | Should show some traffic |
Technical Analysis
Root Cause
The Omada Cloud backend likely uses a simple hash function for MAC address to client tracking:
Suspected Algorithm:
hash_bucket = (sum_of_mac_bytes) % 32
Result: Multiple MAC addresses collide in the same hash bucket, causing traffic aggregation to one device per bucket.
Hash Collision Evidence
- 32 total devices = 2^5 suggests 5-bit hash table
- Zero-traffic devices have active uptime - they're working but not being credited
- Extremely high traffic on few devices - statistical impossibility without aggregation
- Pattern spans multiple switch ports - eliminates local hardware issues
Timeline Pattern
All devices show identical "Last Seen" timestamp (Sep 17, 2025 06:37 am), indicating batch processing by cloud infrastructure rather than real-time updates.
Impact Assessment
Business Impact
- Impossible bandwidth planning - can't identify actual high-usage devices
- Security monitoring failures - can't detect abnormal traffic patterns
- Cost optimization blocked - can't identify devices to traffic-shape
- Compliance issues - inaccurate network usage reporting
Technical Impact
- Monitoring unreliable - 13+ devices showing false zero traffic
- Troubleshooting hindered - can't correlate network issues with usage
- Capacity planning impossible - traffic totals are incorrect
Reproduction Steps
- Deploy TP-Link Omada Cloud with switch-only network
- Connect approximately 32 mixed device types (servers, IoT, cameras, clients)
- Allow devices to remain active for multiple days
- Observe client traffic statistics in Omada Cloud interface
- Note pattern: Few devices with extremely high traffic, many with zero traffic despite active uptime
Expected vs Actual Behavior
Expected
- Each device shows traffic proportional to actual network usage
- Devices with multi-day uptime show some traffic (even minimal)
- Traffic distribution reflects realistic usage patterns
Actual
- Multiple active devices show exactly 0 bytes traffic
- Few devices show unrealistically high traffic volumes
- Traffic pattern suggests aggregation rather than individual usage
- Copy Link
- Report Inappropriate Content
Hi @Suvi
Thanks for the feedback---We can't easily call it a bug.
It appears that all traffic from the devices connected to the Xiaomi router is being reported by the router itself.
The Xiaomi router has NAT (Network Address Translation), which prevents our device from directly accessing information within the Xiaomi router's LAN (as it gets blocked by NAT). The only way we can obtain this data is if the Xiaomi router reports it.
Currently, the Xiaomi router aggregates all client traffic and reports it as a single client's data, without distinguishing between individual devices. As a result, the traffic statistics we receive appear as if they're coming from just one client.
This behavior is actually expected under these network conditions.
To avoid this, you may plug the switch ES208G into the LAN port of the Xiaomi router.
- Copy Link
- Report Inappropriate Content
hello,
thank for a very clear support.
because the support were so good i am now have a set of omada products.
You can assure to your boss that i actually buying set of omada because of the product and support here.
i have 3 questions,
when switch say 1gb usage up 1 gb down, this is since the start? Since 24 hours?
What do i want to do if the switch gonna connect to home server (proxmox). For now it's look like the traffic is getting merged. What if i want the traffic to be counted separately?
if i create one vlan per vm is that gonna differentiate the count ?
last,
i have issue where the client get flag as restricted.
what does it mean can i get it out ?
why restrict i didn't have any bandwidth controls or strom controls rules.
- Copy Link
- Report Inappropriate Content
Information
Helpful: 0
Views: 897
Replies: 9
Voters 0
No one has voted for it yet.