Feature Request: Identify Top Bandwidth Consumers & Granular/Pinch-to-Zoom Charts
I would like to request two major improvements to the Traffic Analytics and Statistics dashboards in both the Omada Controller Web UI and the Omada Mobile App. Currently, diagnosing network anomalies and traffic spikes requires too much manual troubleshooting.
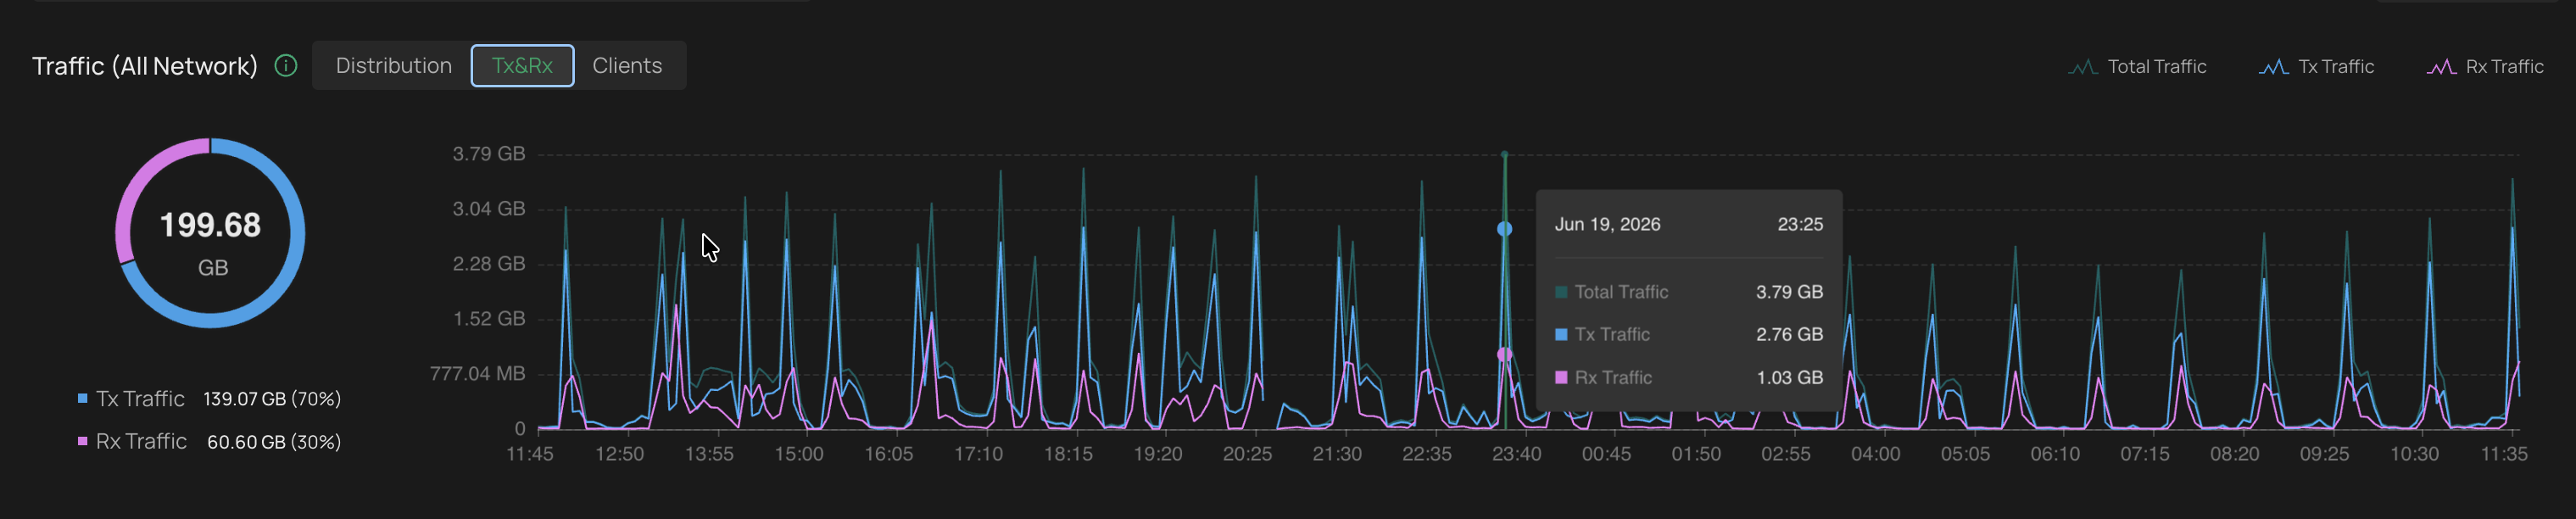
1. Identify Traffic Spike Contributors (Top Consumers)
When looking at the Traffic/Bandwidth chart, it is easy to spot a massive traffic spike, but hard to quickly determine who or what caused it.
-
Request: Please add the ability to interact with the chart to see which client device or AP/Switch had the highest data contribution during a specific timeframe or peak.
-
Suggested Implementation: Hovering over or clicking on a specific peak on the line/bar chart could open a tooltip or a breakdown table showing the "Top 5 Devices" responsible for the traffic at that exact moment.
Real life example below: I can't identify what client causes these regular spikes.
2. Granular Timeframes & Zooming (Pinch-to-Zoom on Mobile)
Currently, the most granular view on the X-axis for many statistics is 1 day. This makes it nearly impossible to analyze short-lived micro-spikes or specific hourly events.
-
Request (Web UI): Allow users to drill down into the charts by selecting a specific timeframe (e.g., 1-hour or 6-hour windows) or manually dragging to zoom into a custom time range.
-
Request (Mobile App): Implement native pinch-to-zoom (pinch-in / pinch-out) gestures on the charts. This would allow administrators to easily expand a specific hour of the day using standard mobile touch interactions.
These additions would transform the Omada analytics tab from a passive reporting tool into a powerful, proactive network troubleshooting dashboard.