SNMP interface counters under-report traffic on WAN ports
 This thread has been locked for further replies. You can start a new thread to share your ideas or ask questions.
While monitoring traffic via SNMP using ifHCInOctets and ifHCOutOctets on the WAN interfaces (eth1.4093 and eth1.4094) of the TP-Link ER605, we noticed that the reported bandwidth is significantly lower than actual usage.
We confirmed that:
-
Traffic was reaching up to 600 Mbps on a client device (verified via tools like
glancesand download speeds). -
The SNMP counters on WAN interfaces reported only a few Mbps, far below expected values.
-
We are using SNMPv2c with 64-bit counters (
ifHC*), and collection interval is 30s.
This suggests that the router may not be exposing the correct WAN-side counters via SNMP, or traffic is bypassing SNMP accounting (e.g., due to NAT or hardware offload).
Steps to reproduce:
-
Enable SNMP on ER605.
-
Monitor WAN interfaces (
ifHCInOctets.1037,1038) during high download.
Expected behavior:
WAN interface counters should reflect the real amount of data being transmitted/received through those interfaces.
- Copy Link
- Subscribe
- Bookmark
- Report Inappropriate Content

Hi @vasartori
Thanks for posting in our business forum.
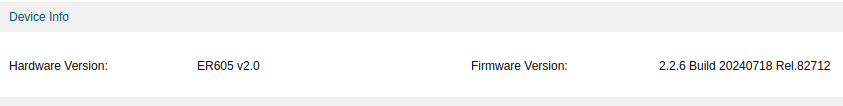
Firmware is not on the latest 2.2.6. Please check the global site and upgrade the firmware to 2.2.6.
If this behaves the same, please post the screenshots for comparison.
- Copy Link
- Report Inappropriate Content
Hello,
Over the weekend, I performed a firmware upgrade. I'm now running the latest version, 2.2.6.
However, SNMP is still not returning correct values.
To provide more context on what I’ve done:
1. Interface Discovery
First, I used SNMP to walk through the OIDs and locate where my WAN interfaces are listed. I ran the following command:
snmpwalk -v2c -c public 192.168.0.1 IF-MIB::ifDescr
IF-MIB::ifDescr.1025 = STRING: default/lo
IF-MIB::ifDescr.1026 = STRING: default/eth0
IF-MIB::ifDescr.1027 = STRING: default/eth1
IF-MIB::ifDescr.1028 = STRING: default/ip6tnl0
IF-MIB::ifDescr.1029 = STRING: default/sit0
IF-MIB::ifDescr.1030 = STRING: default/gre0
IF-MIB::ifDescr.1031 = STRING: default/gretap0
IF-MIB::ifDescr.1032 = STRING: default/bond0
IF-MIB::ifDescr.1033 = STRING: default/veth0
IF-MIB::ifDescr.1036 = STRING: default/br-lan
IF-MIB::ifDescr.1037 = STRING: default/eth1.4094
IF-MIB::ifDescr.1038 = STRING: default/eth1.4093
IF-MIB::ifDescr.2049 = STRING: vnet/lo
IF-MIB::ifDescr.2050 = STRING: vnet/ip6tnl0
IF-MIB::ifDescr.2051 = STRING: vnet/sit0
IF-MIB::ifDescr.2052 = STRING: vnet/gre0
IF-MIB::ifDescr.2053 = STRING: vnet/gretap0
IF-MIB::ifDescr.2058 = STRING: vnet/veth1
IF-MIB::ifDescr.2059 = STRING: vnet/eth0.1
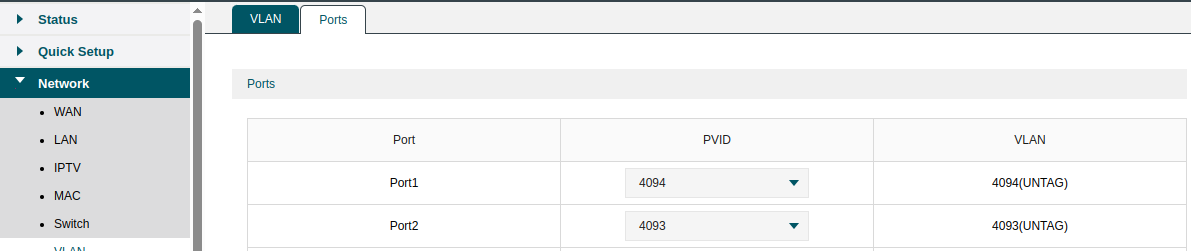
By analyzing the interfaces, I was able to identify the correct SNMP indexes and the respective PVIDs.
2. Data Collection and Graphing with RRDtool
I'm using RRDtool to generate traffic graphs. Here's my process:
a. Create the RRD database:
rrdtool create router_wan.rrd \
  --step 30 \
  DS:univox_in:COUNTER:90:0:U \
  DS:univox_out:COUNTER:90:0:U \
  DS:vivo_in:COUNTER:90:0:U \
  DS:vivo_out:COUNTER:90:0:U \
  RRA:AVERAGE:0.5:1:120 \
  RRA:AVERAGE:0.5:10:288 \
  RRA:AVERAGE:0.5:60:336 \
  RRA:AVERAGE:0.5:240:360 \
  RRA:AVERAGE:0.5:2880:365
b. Create a simple script to collect SNMP data:
ROUTER="192.168.0.1"
COMMUNITY="public"
UNIVOX_IN=$(snmpget -v2c -c $COMMUNITY -Ovq $ROUTER IF-MIB::ifHCInOctets.1037)
UNIVOX_OUT=$(snmpget -v2c -c $COMMUNITY -Ovq $ROUTER IF-MIB::ifHCOutOctets.1037)
VIVO_IN=$(snmpget -v2c -c $COMMUNITY -Ovq $ROUTER IF-MIB::ifHCInOctets.1038)
VIVO_OUT=$(snmpget -v2c -c $COMMUNITY -Ovq $ROUTER IF-MIB::ifHCOutOctets.1038)
rrdtool update router_wan.rrd N:$UNIVOX_IN:$UNIVOX_OUT:$VIVO_IN:$VIVO_OUT
This scripts runs every 30 seconds
3. Generate Graphs
I use the following command to generate graphs:
rrdtool graph router_wan_1h.png --start -1h --step 30 --title 'WAN Traffic (Univox/Vivo) - Last 1h' --vertical-label bits/s --width 800 --height 300 --units=si --lower-limit 0 --rigid \
  DEF:univox_in=router_wan.rrd:univox_in:AVERAGE \
  DEF:univox_out=router_wan.rrd:univox_out:AVERAGE \
  DEF:vivo_in=router_wan.rrd:vivo_in:AVERAGE \
  DEF:vivo_out=router_wan.rrd:vivo_out:AVERAGE \
  CDEF:univox_in_bits=univox_in,8,* \
  CDEF:univox_out_bits=univox_out,8,* \
  CDEF:vivo_in_bits=vivo_in,8,* \
  CDEF:vivo_out_bits=vivo_out,8,* \
  VDEF:univox_in_last=univox_in_bits,LAST \
  VDEF:univox_in_avg=univox_in_bits,AVERAGE \
  VDEF:univox_in_max=univox_in_bits,MAXIMUM \
  VDEF:univox_out_last=univox_out_bits,LAST \
  VDEF:univox_out_avg=univox_out_bits,AVERAGE \
  VDEF:univox_out_max=univox_out_bits,MAXIMUM \
  VDEF:vivo_in_last=vivo_in_bits,LAST \
  VDEF:vivo_in_avg=vivo_in_bits,AVERAGE \
  VDEF:vivo_in_max=vivo_in_bits,MAXIMUM \
  VDEF:vivo_out_last=vivo_out_bits,LAST \
  VDEF:vivo_out_avg=vivo_out_bits,AVERAGE \
  VDEF:vivo_out_max=vivo_out_bits,MAXIMUM \
  LINE1:univox_in_bits#00FF00:'Univox In' \
  GPRINT:univox_in_last:'Current\: %6.2lf %Sb' \
  GPRINT:univox_in_avg:'Average\: %6.2lf %Sb' \
  GPRINT:univox_in_max:'Max\: %6.2lf %Sb\n' \
  LINE1:univox_out_bits#008800:'Univox Out' \
  GPRINT:univox_out_last:'Current\: %6.2lf %Sb' \
  GPRINT:univox_out_avg:'Average\: %6.2lf %Sb' \
  GPRINT:univox_out_max:'Max\: %6.2lf %Sb\n' \
  LINE1:vivo_in_bits#0000FF:'Vivo In' \
  GPRINT:vivo_in_last:'Current\: %6.2lf %Sb' \
  GPRINT:vivo_in_avg:'Average\: %6.2lf %Sb' \
  GPRINT:vivo_in_max:'Max\: %6.2lf %Sb\n' \
  LINE1:vivo_out_bits#000088:'Vivo Out' \
  GPRINT:vivo_out_last:'Current\: %6.2lf %Sb' \
  GPRINT:vivo_out_avg:'Average\: %6.2lf %Sb' \
  GPRINT:vivo_out_max:'Max\: %6.2lf %Sb\n'
This produces a graph like this:
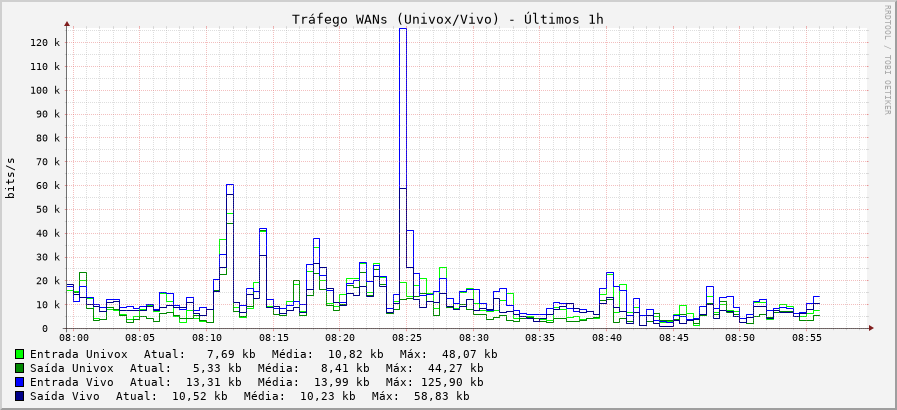
At this point, I'm unsure whether my scripts are incorrect or if the SNMP data itself is faulty.
Additionally, in the past I also tried using Prometheus with the SNMP Exporter and observed the same behavior in the resulting graphs.
- Copy Link
- Report Inappropriate Content
Hi @vasartori
Thanks for posting in our business forum.
vasartori wrote
Hello,
Over the weekend, I performed a firmware upgrade. I'm now running the latest version, 2.2.6.
However, SNMP is still not returning correct values.
To provide more context on what I’ve done:
1. Interface Discovery
First, I used SNMP to walk through the OIDs and locate where my WAN interfaces are listed. I ran the following command:
snmpwalk -v2c -c public 192.168.0.1 IF-MIB::ifDescr
IF-MIB::ifDescr.1025 = STRING: default/lo
IF-MIB::ifDescr.1026 = STRING: default/eth0
IF-MIB::ifDescr.1027 = STRING: default/eth1
IF-MIB::ifDescr.1028 = STRING: default/ip6tnl0
IF-MIB::ifDescr.1029 = STRING: default/sit0
IF-MIB::ifDescr.1030 = STRING: default/gre0
IF-MIB::ifDescr.1031 = STRING: default/gretap0
IF-MIB::ifDescr.1032 = STRING: default/bond0
IF-MIB::ifDescr.1033 = STRING: default/veth0
IF-MIB::ifDescr.1036 = STRING: default/br-lan
IF-MIB::ifDescr.1037 = STRING: default/eth1.4094
IF-MIB::ifDescr.1038 = STRING: default/eth1.4093
IF-MIB::ifDescr.2049 = STRING: vnet/lo
IF-MIB::ifDescr.2050 = STRING: vnet/ip6tnl0
IF-MIB::ifDescr.2051 = STRING: vnet/sit0
IF-MIB::ifDescr.2052 = STRING: vnet/gre0
IF-MIB::ifDescr.2053 = STRING: vnet/gretap0
IF-MIB::ifDescr.2058 = STRING: vnet/veth1
IF-MIB::ifDescr.2059 = STRING: vnet/eth0.1
By analyzing the interfaces, I was able to identify the correct SNMP indexes and the respective PVIDs.
2. Data Collection and Graphing with RRDtool
I'm using RRDtool to generate traffic graphs. Here's my process:
a. Create the RRD database:
rrdtool create router_wan.rrd \
  --step 30 \
  DS:univox_in:COUNTER:90:0:U \
  DS:univox_out:COUNTER:90:0:U \
  DS:vivo_in:COUNTER:90:0:U \
  DS:vivo_out:COUNTER:90:0:U \
  RRA:AVERAGE:0.5:1:120 \
  RRA:AVERAGE:0.5:10:288 \
  RRA:AVERAGE:0.5:60:336 \
  RRA:AVERAGE:0.5:240:360 \
  RRA:AVERAGE:0.5:2880:365
b. Create a simple script to collect SNMP data:
ROUTER="192.168.0.1"
COMMUNITY="public"
UNIVOX_IN=$(snmpget -v2c -c $COMMUNITY -Ovq $ROUTER IF-MIB::ifHCInOctets.1037)
UNIVOX_OUT=$(snmpget -v2c -c $COMMUNITY -Ovq $ROUTER IF-MIB::ifHCOutOctets.1037)
VIVO_IN=$(snmpget -v2c -c $COMMUNITY -Ovq $ROUTER IF-MIB::ifHCInOctets.1038)
VIVO_OUT=$(snmpget -v2c -c $COMMUNITY -Ovq $ROUTER IF-MIB::ifHCOutOctets.1038)
rrdtool update router_wan.rrd N:$UNIVOX_IN:$UNIVOX_OUT:$VIVO_IN:$VIVO_OUT
This scripts runs every 30 seconds
3. Generate Graphs
I use the following command to generate graphs:
rrdtool graph router_wan_1h.png --start -1h --step 30 --title 'WAN Traffic (Univox/Vivo) - Last 1h' --vertical-label bits/s --width 800 --height 300 --units=si --lower-limit 0 --rigid \
  DEF:univox_in=router_wan.rrd:univox_in:AVERAGE \
  DEF:univox_out=router_wan.rrd:univox_out:AVERAGE \
  DEF:vivo_in=router_wan.rrd:vivo_in:AVERAGE \
  DEF:vivo_out=router_wan.rrd:vivo_out:AVERAGE \
  CDEF:univox_in_bits=univox_in,8,* \
  CDEF:univox_out_bits=univox_out,8,* \
  CDEF:vivo_in_bits=vivo_in,8,* \
  CDEF:vivo_out_bits=vivo_out,8,* \
  VDEF:univox_in_last=univox_in_bits,LAST \
  VDEF:univox_in_avg=univox_in_bits,AVERAGE \
  VDEF:univox_in_max=univox_in_bits,MAXIMUM \
  VDEF:univox_out_last=univox_out_bits,LAST \
  VDEF:univox_out_avg=univox_out_bits,AVERAGE \
  VDEF:univox_out_max=univox_out_bits,MAXIMUM \
  VDEF:vivo_in_last=vivo_in_bits,LAST \
  VDEF:vivo_in_avg=vivo_in_bits,AVERAGE \
  VDEF:vivo_in_max=vivo_in_bits,MAXIMUM \
  VDEF:vivo_out_last=vivo_out_bits,LAST \
  VDEF:vivo_out_avg=vivo_out_bits,AVERAGE \
  VDEF:vivo_out_max=vivo_out_bits,MAXIMUM \
  LINE1:univox_in_bits#00FF00:'Univox In' \
  GPRINT:univox_in_last:'Current\: %6.2lf %Sb' \
  GPRINT:univox_in_avg:'Average\: %6.2lf %Sb' \
  GPRINT:univox_in_max:'Max\: %6.2lf %Sb\n' \
  LINE1:univox_out_bits#008800:'Univox Out' \
  GPRINT:univox_out_last:'Current\: %6.2lf %Sb' \
  GPRINT:univox_out_avg:'Average\: %6.2lf %Sb' \
  GPRINT:univox_out_max:'Max\: %6.2lf %Sb\n' \
  LINE1:vivo_in_bits#0000FF:'Vivo In' \
  GPRINT:vivo_in_last:'Current\: %6.2lf %Sb' \
  GPRINT:vivo_in_avg:'Average\: %6.2lf %Sb' \
  GPRINT:vivo_in_max:'Max\: %6.2lf %Sb\n' \
  LINE1:vivo_out_bits#000088:'Vivo Out' \
  GPRINT:vivo_out_last:'Current\: %6.2lf %Sb' \
  GPRINT:vivo_out_avg:'Average\: %6.2lf %Sb' \
  GPRINT:vivo_out_max:'Max\: %6.2lf %Sb\n'
This produces a graph like this:
At this point, I'm unsure whether my scripts are incorrect or if the SNMP data itself is faulty.
Additionally, in the past I also tried using Prometheus with the SNMP Exporter and observed the same behavior in the resulting graphs.
What does the graph mean? What part is not adding up to the values?
How do you identify the readings you extracted from the SNMP that do not match your real traffic?
- Copy Link
- Report Inappropriate Content
Information
Helpful: 0
Views: 969
Replies: 3
Voters 0
No one has voted for it yet.