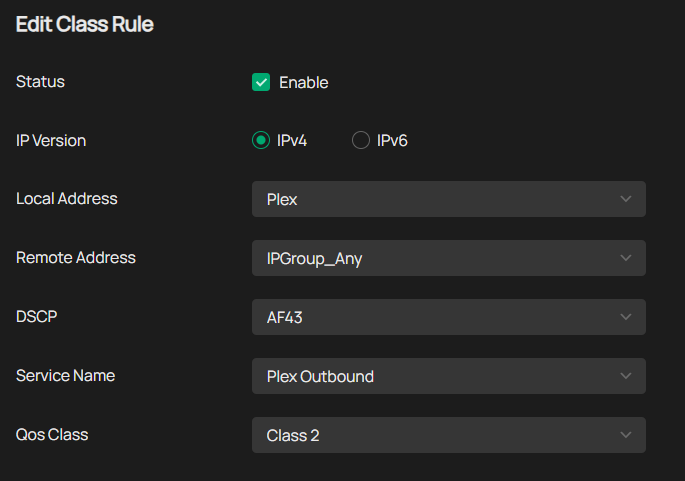
Omada Controller QoS Data Up/Down arrow
 This thread has been locked for further replies. You can start a new thread to share your ideas or ask questions.
I have been monitoring traffic using the Insights -> QoS Data. The up and down arrow represent data going... well here is the part that got me confused; outbound (up arrow) and inbound (down arrow) right?
in my mind, the up arrow is outbound from the gateway to Internet/Cloud and vis versa right? Even in the Settings -> Gateway QoS. The inbound arrow is blue, and outbound is cyan. Which matches the arrow's color in QoS Data. The only difference is that the QoS data has a circle around the arrow............ does that automatically make it "opposite"? ![]()
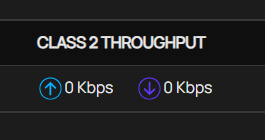
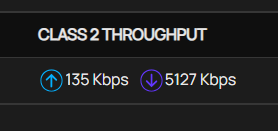
However, during my testing when moving large data into the internet/cloud (outbound from LAN->WAN), it's always the down arrow that is getting the big Kbps read out. Is it supposed to indicate as such?